Visualization
Process control and optimization through visualized process data
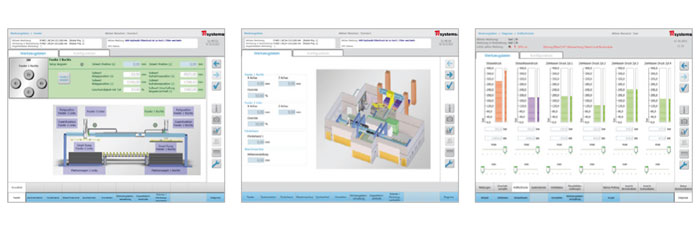
In order to keep industrial processes firmly under control and to be able to react quickly to faults or errors, efficient and easy-to-operate visualization software is especially important.
TR-Electronic develops application-specific software for the visualization of process data. This can be integrated seamlessly into your machine and system control, is intuitive to operate and can be adapted to new requirements without problem.
Standard functions of our visualization software:
- Process data management
- Input
- Storage in XML format
- Output
- Creation, storage and management of formulas
- Diagnosis
- Error message
- Error archive
- Fault location display
- Measured data acquisition: display of process values, e.g. pressure, force, speed, position etc.
- User management: configurable, hierarchical authorization for changes and process interventions
- Synoptic representation: graphic representation of conditions which must be fulfilled, in order for the machine to be in operational condition
Technical data:
- Connection to various PLC controllers (TR-Electronic, Beckhoff, Siemens, and others)
- Server-client architecture for several autonomous operating stations per machine
- Based on the Microsoft.Net Framework
- Framework for own extensions